Grafana dashboard
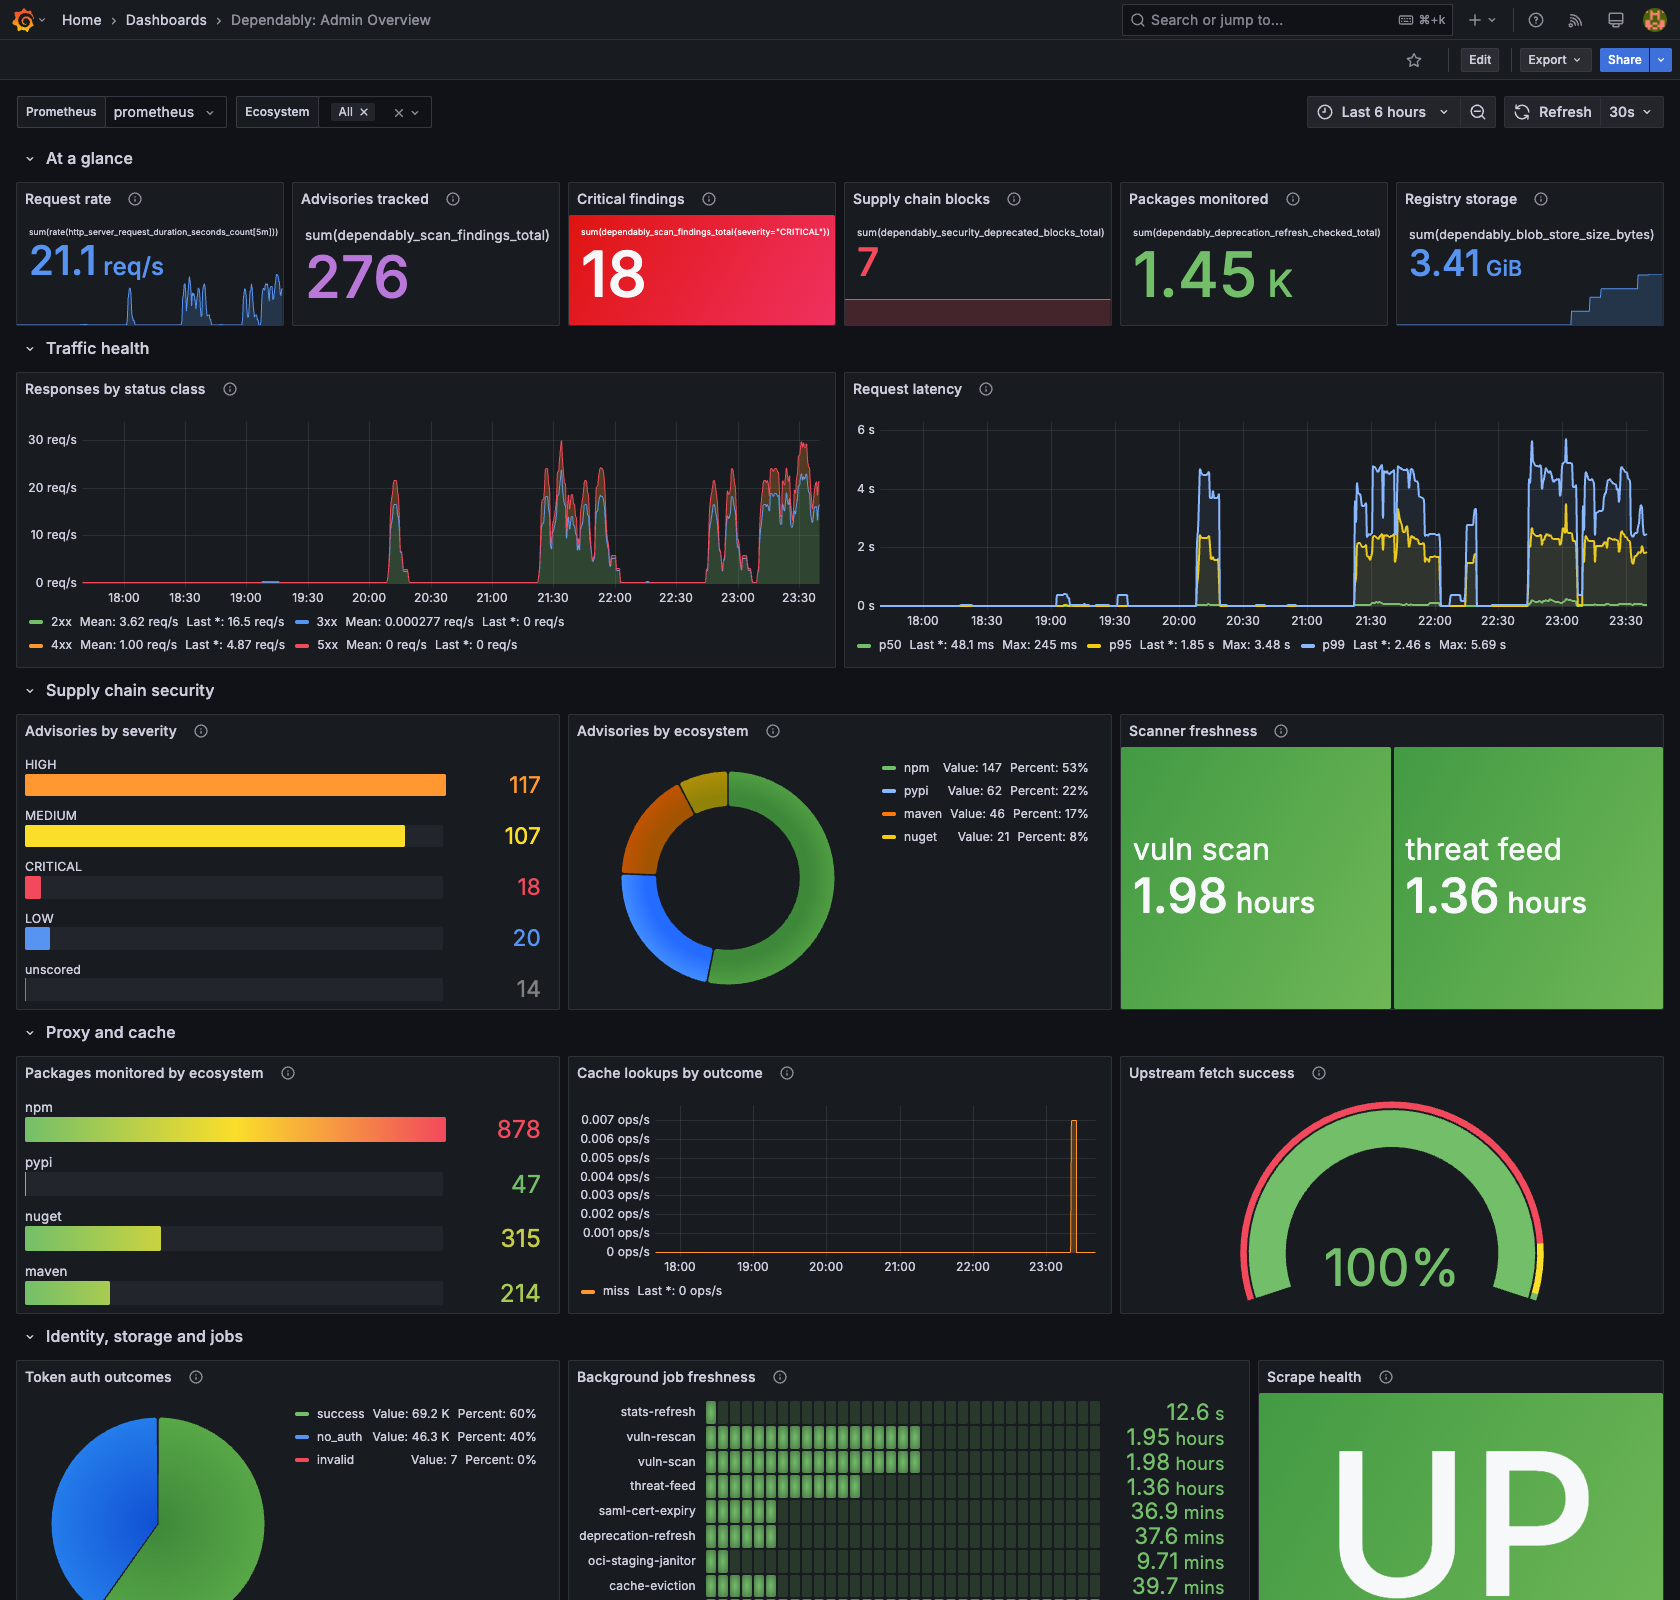
A ready-made Grafana dashboard for watching a single Dependably instance. It leads with supply-chain value — advisories tracked, critical findings, downloads blocked, packages monitored — then covers traffic health, vulnerability posture, proxy and cache activity, identity, storage, and background-job freshness. The 17 panels are grouped into five rows so you can read it top to bottom.
It is aimed at an admin running one self-hosted instance. It queries
Prometheus only, so the only moving parts are the Dependably /metrics
endpoint and a Prometheus server that scrapes it.
Download the dashboard
(dependably-admin-overview.json) — import it into Grafana as described below.
Grafana and Prometheus are separate processes. They are not part of Dependably. This guide assumes you already run them, or can stand them up (Grafana 10+ / 11.x with a Prometheus data source).
Prerequisites
1. Expose the metrics endpoint
Dependably serves Prometheus metrics at GET /metrics on the same host and port
as the registry. The endpoint is gated two ways:
- Enabled flag — on by default. If it is off, the endpoint returns
404. Set the
METRICS_ENABLEDenvironment variable (or themetrics_enabledinstance setting) totrueto turn it on. - IP allowlist — only callers whose IP is on the allowlist get a 200;
everyone else gets 403. The default allowlist is
127.0.0.1, ::1(localhost only). Add the IP of your Prometheus server with theMETRICS_ALLOWED_IPSenvironment variable — a comma-separated list of IPs or CIDR ranges.
METRICS_ENABLED=true
METRICS_ALLOWED_IPS=127.0.0.1,::1,10.0.0.5
Precedence: environment variable → instance setting → built-in default. When an environment variable is set, the matching field is locked in the admin UI so there is no conflicting state. If you scrape across a network, remember that
/metricsis unauthenticated — the IP allowlist (plus your reverse proxy or firewall) is what protects it.
The endpoint emits only aggregate counters, gauges, and histograms. It carries no per-tenant, per-user, or per-package labels and no secrets.
2. Scrape it with Prometheus
Point Prometheus at the endpoint. Use the job name dependably so the
dashboard's scrape-health panel matches:
scrape_configs:
  - job_name: dependably
    metrics_path: /metrics
    scheme: https
    static_configs:
      - targets: ["repo.example.com"]
Reload Prometheus and confirm the target is UP under Status → Targets before importing the dashboard.
Import the dashboard
Grafana 10.0+ / 11.x. Two equivalent paths.
UI import
- In Grafana, go to Dashboards → New → Import.
- Upload
dependably-admin-overview.json(or paste its contents). - When prompted, pick your Prometheus data source for
DS_PROMETHEUS. - Save.
Provisioned import
For config-as-code, drop the JSON into Grafana's provisioned-dashboards directory and add a provider:
apiVersion: 1
providers:
  - name: dependably
    folder: Dependably
    type: file
    options:
      path: /etc/grafana/provisioning/dashboards/dependably
Place dependably-admin-overview.json at
/etc/grafana/provisioning/dashboards/dependably/ and restart Grafana.
What the file looks like
The dashboard is a standard Grafana JSON model — the same shape Grafana exports when you click Export on a dashboard you built in the UI. You don't need to read it to use it; import the file and you're done. For reference, the header and first panel look like this:
{
  "uid": "dependably-admin-overview",
  "title": "Dependably: Admin Overview",
  "schemaVersion": 39,
  "refresh": "30s",
  "templating": {
    "list": [
      { "name": "DS_PROMETHEUS", "type": "datasource", "query": "prometheus" },
      { "name": "ecosystem", "type": "query",
        "query": "label_values(dependably_scan_findings_total, ecosystem)",
        "includeAll": true, "multi": true }
    ]
  },
  "panels": [
    {
      "type": "stat",
      "title": "Request rate",
      "targets": [
        { "expr": "sum(rate(http_server_request_duration_seconds_count[5m]))" }
      ]
    }
  ]
}
The full file defines all 17 panels
and an ecosystem filter you can scope to npm, PyPI, or NuGet.
What the panels show
At a glance — the headline supply-chain and health numbers:
| Panel | Answers |
|---|---|
| Request rate | How much traffic the instance is serving right now |
| Advisories tracked | Total vulnerability advisories the scanner has recorded |
| Critical findings | Advisories at CRITICAL severity — green at 0, red at 5+ |
| Supply chain blocks | Downloads refused by a policy gate (e.g. the deprecated-package gate) |
| Packages monitored | Package checks the deprecation-refresh job has performed (catalogue coverage) |
| Registry storage | Bytes held across all blob-store tiers |
Traffic health:
| Panel | Answers |
|---|---|
| Responses by status class | Request rate split by 2xx/3xx/4xx/5xx — watch the 5xx line |
| Request latency | p50 / p95 / p99 server request duration |
Supply chain security:
| Panel | Answers |
|---|---|
| Advisories by severity | The shape of your risk for the selected ecosystem |
| Advisories by ecosystem | Which package ecosystem carries the most advisories |
| Scanner freshness | Time since the vuln-scan and threat-feed jobs last succeeded |
Proxy and cache:
| Panel | Answers |
|---|---|
| Packages monitored by ecosystem | Spread of deprecation-refresh coverage across registries |
| Cache lookups by outcome | Hit vs miss rate — the hit share climbs as the cache warms |
| Upstream fetch success | Share of upstream fetches that succeeded |
Identity, storage and jobs:
| Panel | Answers |
|---|---|
| Token auth outcomes | success / no_auth / invalid mix — watch invalid for credential probing |
| Background job freshness | Time since each background job last completed successfully |
| Scrape health | Whether Prometheus can reach the instance at all (UP / DOWN) |
No data on a panel is normal. The supply-chain and vulnerability panels stay empty until a gate fires or the scanner records a finding; the cache and upstream panels populate once your tools start pulling packages.
What it does not show
By design, the metrics behind this dashboard carry no high-cardinality labels — no per-tenant, per-user, or per-package breakdowns. The numbers here are instance-wide. For in-product counts (total packages, active users, recent downloads, blocked pulls), use the built-in Overview page in the web console.