Overview dashboard
The Overview is the first page after sign-in and the page the Dependably logo returns you to. It answers, at a glance: how much is in the registry, what is being pulled, what is being blocked, and where the risk sits.
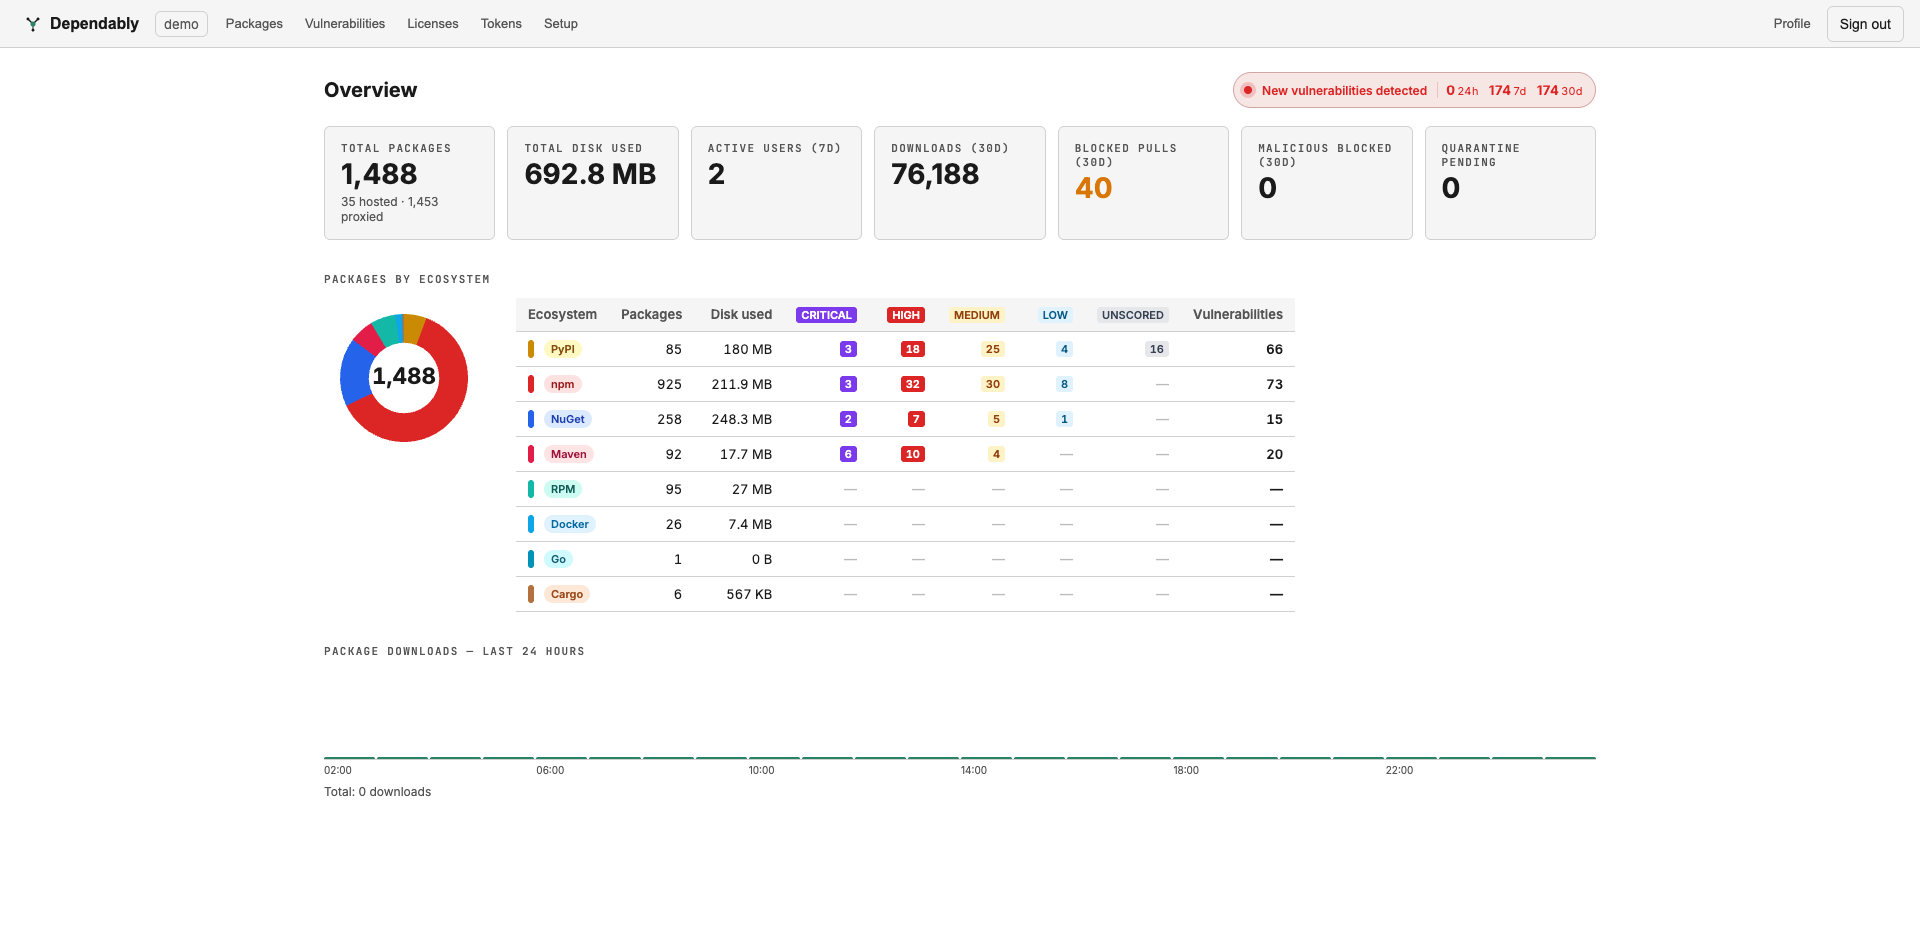
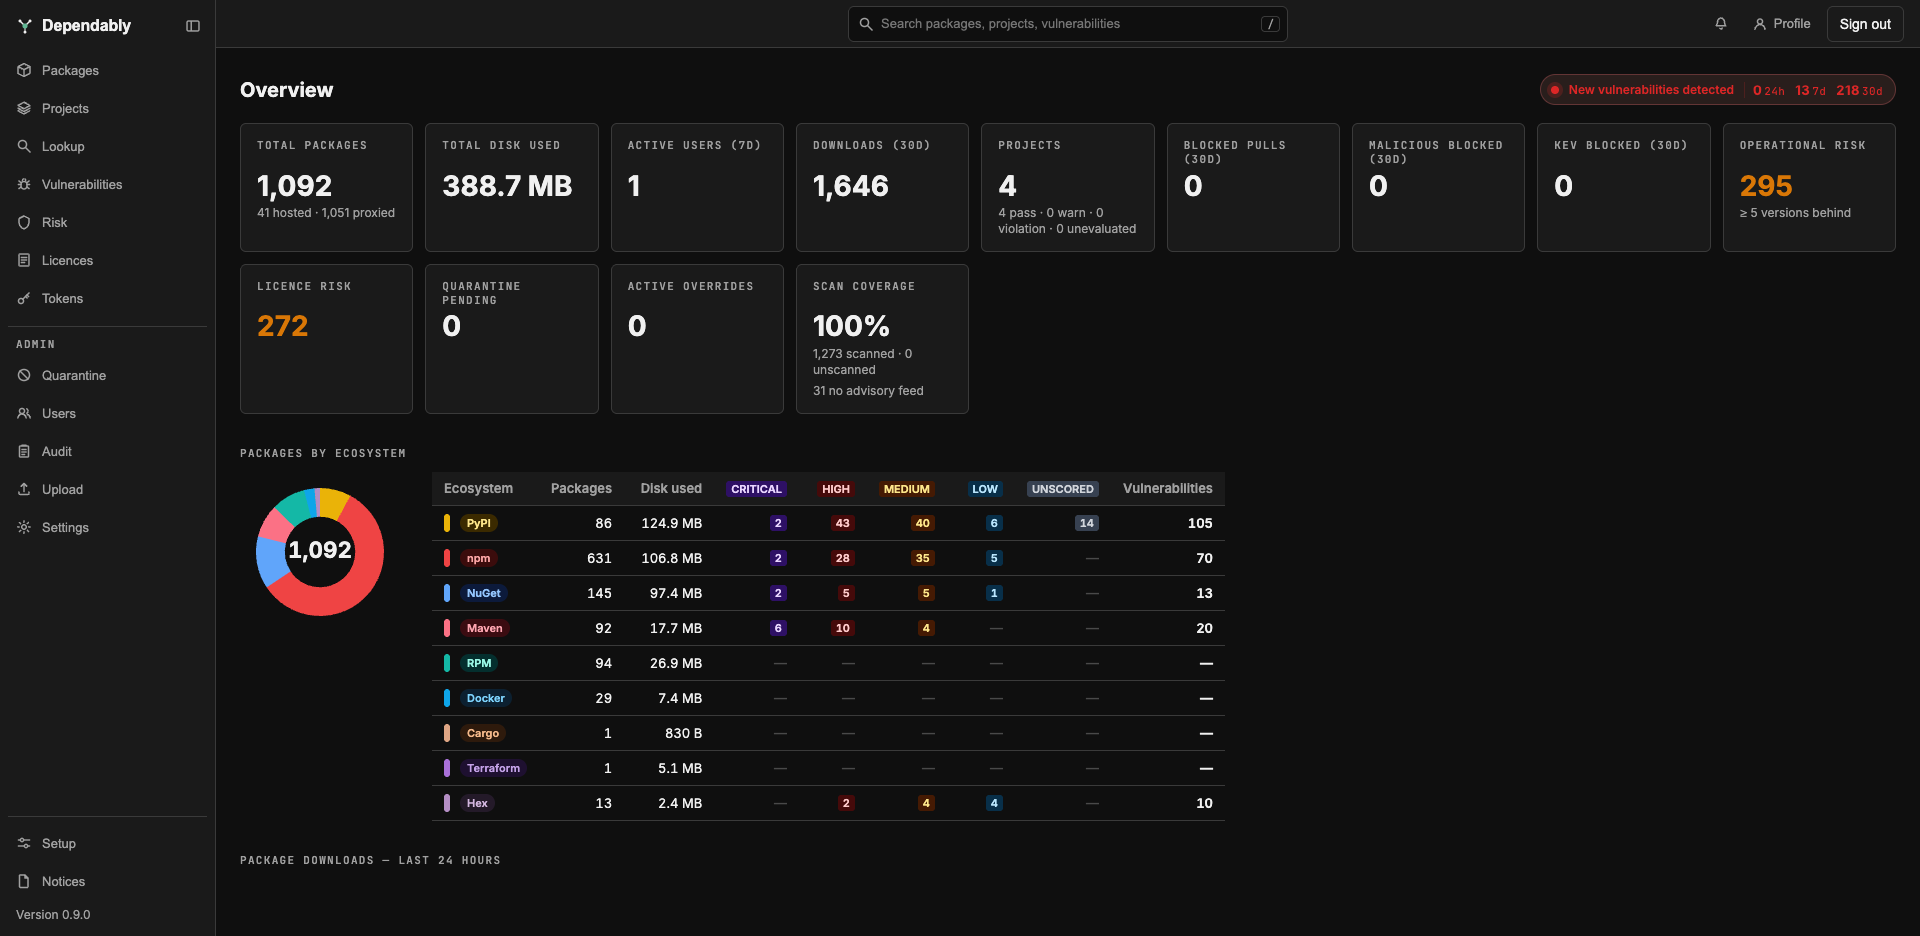
All numbers cover your organization only. The scoring terms (CVSS, EPSS, KEV) are defined in the Glossary.
New vulnerabilities
The ribbon in the top corner reads New vulnerabilities detected or No new vulnerabilities, with counts for the last 24h, 7d, and 30d. It counts advisories the scanner matched to one of your cached versions in that window, so an old advisory on a package you cached yesterday counts as new. Select it to open Vulnerabilities sorted newest first.
When your organization has SAML single sign-on configured and the identity provider's signing certificate expires within 7 days, a SAML cert expiring card shows the days remaining. Once the certificate has expired, a SAML cert expired card shows the expiry date. Either card is a cue to tell an administrator.
Metric cards
| Card | What it counts |
|---|---|
| Total packages | Every package across all ecosystems, split into hosted (published to your registry) and proxied (cached from an upstream). |
| Total disk used | Storage occupied by all cached and published artefacts. When your organization has a storage quota, the card shows it. |
| Active users (7d) | Distinct people and service tokens with recorded activity in the last 7 days. A personal token counts as the person who owns it. |
| Downloads (30d) | Downloads served in the last 30 days, including first fetches from upstream. Blocked attempts are not counted. |
| Projects | Your organization's projects (folders are not counted), and how many of their latest versions pass, warn, violate, or await policy evaluation. Select it to open Projects. |
| Blocked pulls (30d) | Downloads refused in the last 30 days, by a policy gate or by a manual block. Hover for the count per gate. |
| Malicious blocked (30d) | How many of those the malware gate refused. |
| KEV blocked (30d) | How many of those the Known Exploited Vulnerabilities gates refused, including the ransomware gate. |
| Operational risk | Packages with at least one cached version that is 5 or more stable releases behind upstream. Select it to open Risk. |
| Licence risk | Cached versions whose licence is on the block list, or that have no licence recorded at all. Select it to open Risk. |
| Quarantine pending | Versions a gate has held that are waiting for an administrator's decision. |
| Active overrides | Versions an administrator has approved out of quarantine, and how old the oldest approval is. |
| Scan coverage | The share of versions the vulnerability scanner has checked, with the scanned and unscanned counts. Versions in an ecosystem that has no vulnerability database are shown as a third count and left out of the percentage. |
For a member, the blocked, quarantine, and override cards show the number only. Roles that can open the Audit log select a blocked card to see the matching events, and administrators select the quarantine and override cards to open the matching Quarantine view.
Packages by ecosystem
A doughnut chart shows each ecosystem's share of the package total. Beside it a table lists, per ecosystem, the package count, disk used, the number of advisories at each severity (CRITICAL, HIGH, MEDIUM, LOW, and UNSCORED for advisories that carry no score), and their total under Vulnerabilities. These are current counts, not a 30-day window. An ecosystem is listed when it has packages or advisories.
Package downloads — last 24 hours
A bar per hour of downloads served over the last day, with the total beneath. Blocked attempts are not included.
Trends (30d)
The Vulnerabilities, Blocked pulls, and Downloads cards track the advisory total from the ecosystem table, Blocked pulls (30d), and Downloads (30d), recorded once a day. Each shows today's value, the change against the value 7 days ago, and a sparkline of up to 30 days. Until two days have been recorded, the section reads Not enough history yet.
Prevention (30d)
One count per policy gate shows how many downloads that gate refused in the last 30 days, busiest gate first; together they add up to Blocked pulls (30d). The gates are deprecated, revoked, release age, licence, install script, provenance, malicious, KEV, KEV · ransomware, EPSS, and vuln score, and a manual count joins them when an administrator blocked a version by hand. A gate that never fired shows 0. When nothing was blocked, a note says whether every pull passed or no pulls were served. What each gate checks, and its enforcement mode, is set by an administrator in Settings.